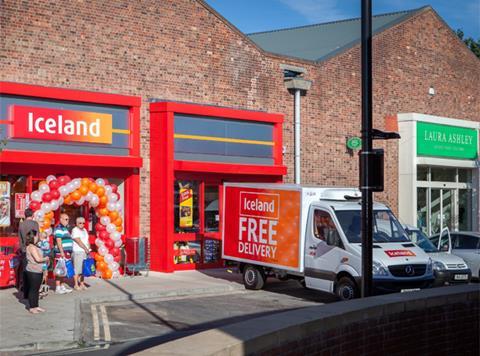
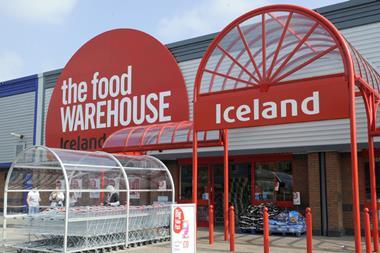
Iceland has posted its first drop in sales since 2005, according to the latest grocery market share data from Kantar Worldpanel.
The frozen discounter’s sales fell 0.3% in the 12 weeks to 20 July 2014, Kantar Worldpanel said. Despite the fall, Iceland’s market share remained at 2% during the three-month period.
Tesco, Morrisons and The Co-operative Group also recorded declining sales. Sales at Tesco and Morrisons both fell by 3.8%. Tesco’s market share fell from 30.3% last year to 28.9%, while Morrisons’ fell from 11.5% to 11%.
Sales at The Co-op declined 2.1%, while its market share dipped from 6.5% to 6.3%.
Aldi and Lidl were once again the strongest performing retailers during the period, racking up sales growth of 32.2% and 19.5% respectively.
“Aldi’s 32% growth rate has lifted its market share to 4.8%; this is a new record for the retailer and means it has nearly caught up with Waitrose on 4.9%,” said Kantar Worldpanel director Edward Garner.
“Similarly, Lidl sales have grown by nearly 20% and it has held onto its record share of 3.6%.”
Among the big four, both Asda and Sainsbury’s held onto their market shares of 17% and 16.6% respectively. Asda recorded sales growth of 0.9%, while Sainsbury’s recorded sales growth of 1.2%.
Kantar Worldpanel also said grocery price inflation had fallen for the 10th successive period and now stood at 0.4%.
Competitive pricing and deflation in the price of staple items has driven inflation to the lowest level since October 2006 when Kantar Worldpanel began this measure, it said. In turn, market growth fell to 0.9% - the lowest figure for 10 years.
| Total Till Roll - GB Consumer Spend | |||||
|---|---|---|---|---|---|
| 12 weeks to 21 July 2013 | 12 Weeks to 20 July 2014 | % Change | |||
| £000s | % ** | £000s | % ** | % | |
| Total Till Roll | 32,178,400 | 32,459,920 | 0.9% | ||
| Total Grocers | 24,874,620 | 100.0% | 25,096,290 | 100.0% | 0.9% |
| Total Multiples | 24,356,800 | 97.9% | 24,580,030 | 97.9% | 0.9% |
| Tesco | 7,535,618 | 30.3% | 7,248,330 | 28.9% | -3.8% |
| Asda | 4,224,824 | 17.0% | 4,264,216 | 17.0% | 0.9% |
| Sainsbury’s | 4,122,739 | 16.6% | 4,173,881 | 16.6% | 1.2% |
| Morrisons | 2,867,962 | 11.5% | 2,758,776 | 11.0% | -3.8% |
| The Co-operative | 1,607,447 | 6.5% | 1,573,334 | 6.3% | -2.1% |
| Waitrose | 1,195,139 | 4.8% | 1,235,289 | 4.9% | 3.4% |
| Aldi | 912,814 | 3.7% | 1,206,659 | 4.8% | 32.2% |
| Lidl | 766,137 | 3.1% | 915,595 | 3.6% | 19.5% |
| Iceland | 499,632 | 2.0% | 498,379 | 2.0% | -0.3% |
| Farmfoods | 159,625 | 0.6% | 184,880 | 0.7% | 15.8% |
| Other Multiples | 464,869 | 1.9% | 520,694 | 2.1% | 12.0% |
| Symbols & Independents | 517,815 | 2.1% | 516,254 | 2.1% | -0.3% |
** = Percentage Share of Total Grocers






No comments yet